Solving Inequalities and Graphing the Solution Set – A Visual Algebra Guide
This post presents a step-by-step visual solution for solving a compound inequality and graphing the answer on a number line. Perfect for students in Algebra 1, College Algebra, or those preparing for standardized tests.
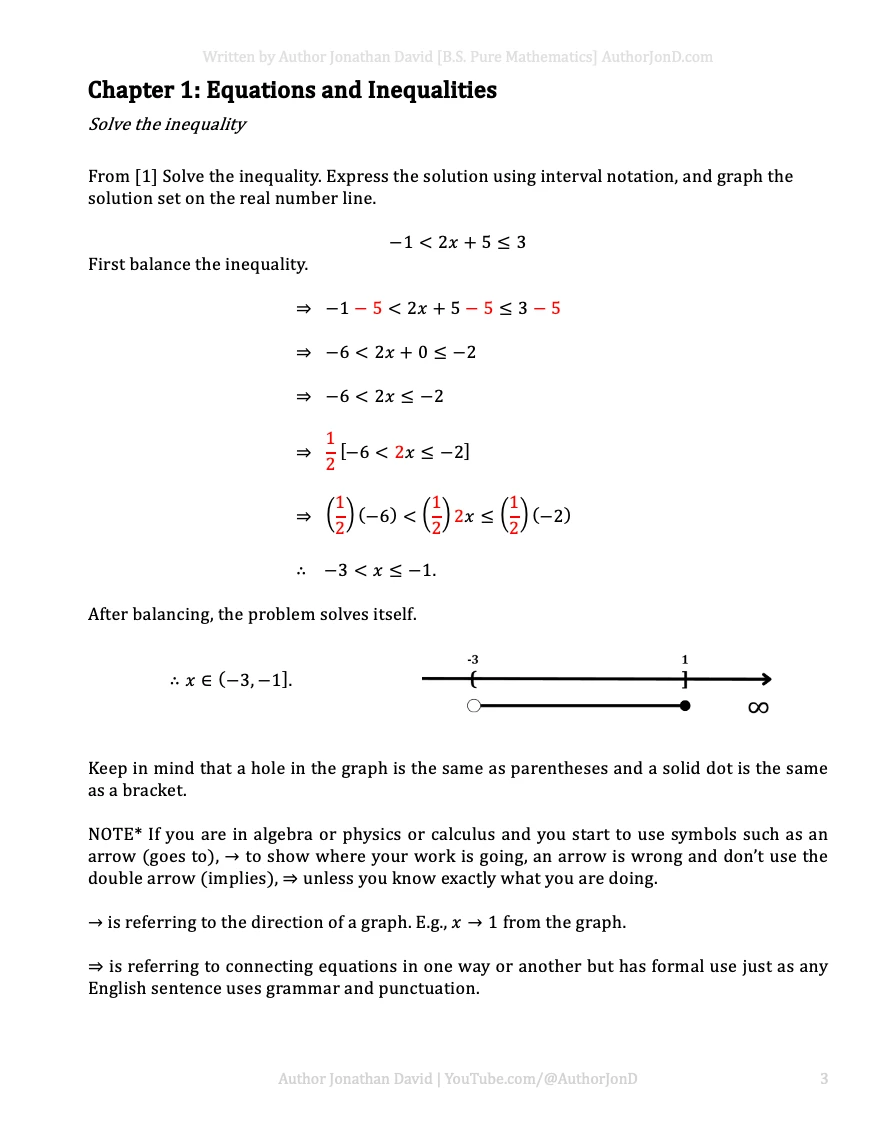
The image walks through how to solve the inequality:
–1 < 2x + 5 ≤ 3
by isolating the middle expression and then dividing all sides by 2. The final solution:
–3 < x ≤ –1
is then written in interval notation as (–3, –1] and graphed correctly with an open and closed dot.
Key concepts covered:
-
Solving compound inequalities
-
Proper use of inequality symbols
-
Converting inequality solutions to interval notation
-
Understanding open vs. closed intervals on a graph
-
Avoiding misuse of → and ⇒ in math proofs and solutions
This image is from Chapter 1 of the Ultimate Crash Course for STEM Majors—a comprehensive math guide built to support your success in every STEM subject.
Get the full crash course and lifetime updates here:
https://author-jonathan-david-shop.fourthwall.com/products/the-ultimate-crash-course-includes-bonus-ultimate-cheat-sheet-800-pages-of-goodness
Explore all my resources and bundles:
https://author-jonathan-david-shop.fourthwall.com
Search tags: solving inequalities algebra, graphing compound inequalities, inequality solution set, interval notation tutorial, algebra 1 inequality graph, open vs closed interval, how to solve linear inequalities, algebra study guide, number line inequality example.

