How to Find Amplitude, Period, and Phase Shift of Sinusoidal Functions – A Complete Guidee
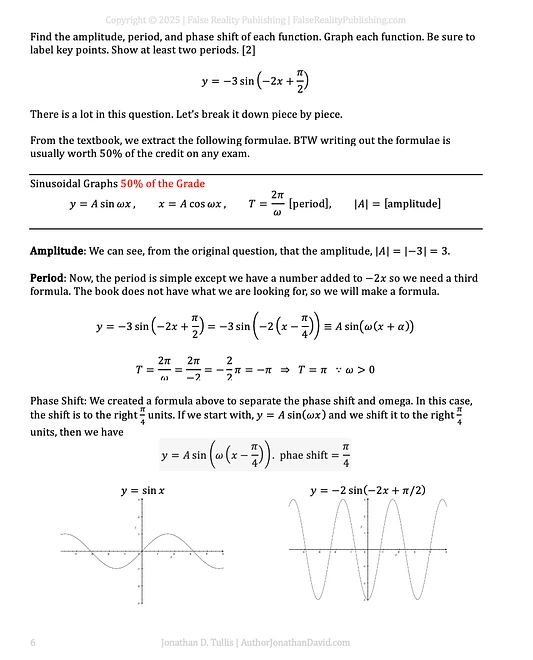
This post is a full breakdown of how to analyze and graph sine functions, including how to extract amplitude, period, and phase shift from a transformed equation. The focus is on the function:
y = –3·sin(–2x + π/2)
Using the standard sinusoidal form y = A·sin(ωx + φ), the image guides you through:
-
Amplitude: |A| = 3
-
Period: T = 2π / |–2| = π
-
Phase Shift: π/4 units to the right, found by rewriting the expression into the form –2(x – π/4)
It explains how to:
-
Use the standard formula for period and phase shift
-
Recognize that a negative ω value does not change the period since it's based on |ω|
-
Identify how amplitude reflects the height of the wave from midline to crest
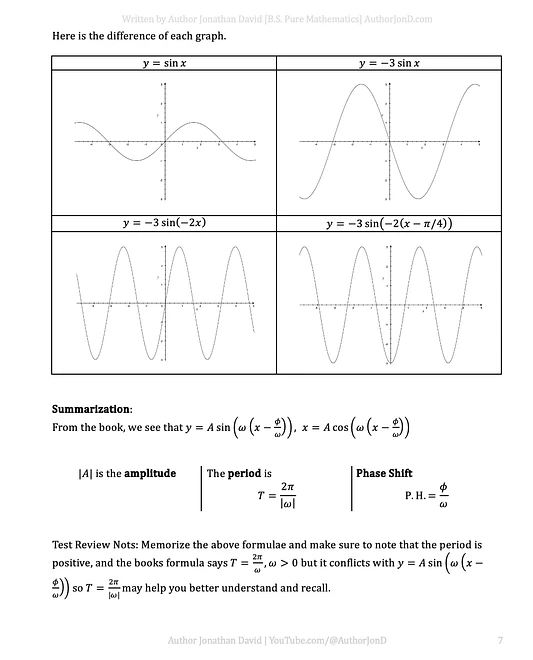
The second page includes side-by-side graphs comparing:
-
y = sin(x)
-
y = –3·sin(x)
-
y = –3·sin(–2x)
-
y = –3·sin(–2(x – π/4))
These visual comparisons help you see how each transformation affects the graph—whether it’s a reflection, vertical stretch, horizontal compression, or a phase shift.
These visuals are taken directly from the Ultimate Crash Course for STEM Majors, which includes graphing techniques, trigonometric transformations, and test-prep strategies for every major topic in college algebra and precalculus.
Get the complete guide with lifetime access:
https://author-jonathan-david-shop.fourthwall.com/products/the-ultimate-crash-course-includes-bonus-ultimate-cheat-sheet-800-pages-of-goodness
View all resources and bundles here:
https://author-jonathan-david-shop.fourthwall.com
Search tags: find amplitude and phase shift, how to graph sine functions, period of sine curve, y = –3·sin(–2x + π/2), trig transformations graph, phase shift explained, sinusoidal formula graph, graphing trigonometry step-by-step.

